| Comparison of Effects of Genomic Contamination on Submicro and Direct Incorporation Labeling methods. |
| |
|
 |
|
 |
|
In addition to its RNA-dependent DNA polymerase activity, reverse transcriptase has several other enzymatic activities. These additional activities can include an RNAse H like activity, a DNA dependent DNA polymerase activity, and a terminal deoxynucleotide transferase like DNA polymerase activity. (See Sambrook, J., Fritsch, E.F., and Maniatis, T. Molecular Cloning, A Laboratory Manual (Second Edition) at page 5.34). Since the substrate or template for the later two activities is DNA, any genomic DNA contaminating an RNA sample can contribute to the signal generated on a microarray when the label is in the form of a nucleotide triphosphate included in the synthesis reaction. Significantly, the signal attributable to genomic DNA contamination will be generated even in the absence of primer or RNA. In order to understand the effect that contaminating genomic DNA has on the results of microarray experiments, we have performed several experiments, including experiments comparing direct incorporation and the Genisphere Submicro labeling method in the presence or absence of dT primer. Below are some of the results from these experiments. |
| |
|
|
 |
|
Experiment 1:
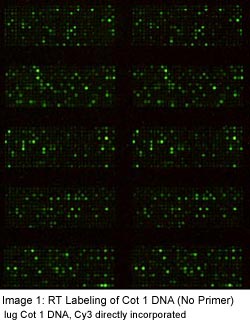
Direct incorporation labeling of CoT1 DNA using reverse transcriptase.
1 microgram of CoT1 was enzymatically labeled by the standard direct incorporation method using Cy™3-dCTP as the label. The sample was then hybridized to a microarray. The results are displayed in Image 1. It is evident from the observed signal pattern that the CoT1 DNA was efficiently labeled by the reverse transcriptase and demonstrates a clone-specific binding to the microarray.
Experiment 2:
Total RNA labeling using the direct incorporation and Submicro methods with and without primer.
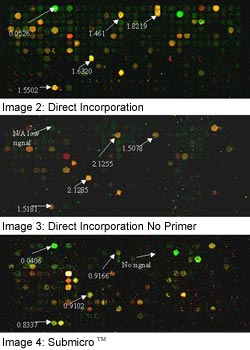
Two different commercial RNA samples (DNase treated by the manufacturer), human placenta (Cy3) and heart (Cy™5), were labeled using either standard direct incorporation (20 micrograms of total RNA), direct incorporation without dT primer (20 micrograms of total RNA), Genisphere Submicro (4 micrograms of total RNA), or Genisphere Submicro without primer (4 micrograms of total RNA). The images presented below represent overlay images of the Cy3 (green) and Cy5 (red) channels. |
| |
|
|
Click here for close-up of Images
|
|
The arrays of Image 2, Image 3 and Image 4 have been hybridized with RNA samples labeled by direct incorporation (top), direct incorporation without primer (middle), and the Submicro kit (bottom). The images have been annotated to include differentials for a few representative features on each array. (The differentials are an average of two data points from the same array.) Comparison of the data obtained from the Submicro method to data from direct incorporation with and without primer indicates that some of the differentials observed in direct incorporation are due to the presence of contaminating genomic DNA. The basis for this conclusion is that differential results from the direct incorporation labeling with primer (Image 2) and the Submicro labeling (Image 4) are very similar for those features that do not show signal that is due to genomic contamination (Image 3). However, on features that do show significant signal attributable to genomic contamination, the differential results produced by direct incorporation and Submicro labeling diverge, with the differential produced by direct incorporation often being the same as, or similar to, the differential that is attributable to genomic contamination. |
| |
|
|
Click here for close-up of Images
|
|
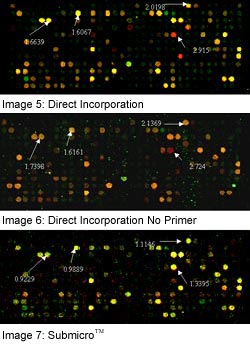
Images 5, 6 and 7 represent a second set of experiments similar to those shown in Images 2, 3 and 4. |
| |
|
|

Click here for close-up of Image
|
|
Image 8 represents results obtained using the Submicro™ kit without primer. Only one image is provided since results were negative for all replicates.
These experiments have been reproduced on additional arrays with these and other total RNA samples purchased from the same commercial source, as well as with total RNA samples prepared by Genisphere. These experiments have consistently shown that the direct incorporation method will label genomic DNA. The amount of signal generated by this labeling will, however, vary from sample to sample. Additional experiments (data not shown) have been performed using total RNA samples treated with RNase prior to reverse transcription; as expected, these samples produced results similar to those produced by the "no primer" experiments (Images 3, 6 and 8). |
| |
|
|
|
| |
 |
|